You're reviewing a company record before routing an account, planning a hiring campaign, or comparing potential customers. The employee total looks straightforward, until another source shows a different figure and your finance team asks whether either number represents full-time staff.
The headcount of employees answers a narrow question: how many people fall within a defined employment boundary at a particular time? To use it well, you need to distinguish people from work, check who's included, and resist treating every increase as evidence of business growth.
Table of Contents
- Headcount vs FTE at a Glance
- How Headcount Is Counted Step by Step
- What Changes the Number and Who Is Counted
- Converting Headcount to FTE with Worked Examples
- Using Headcount in Product and GTM Workflows
- Why a Rising Headcount Does Not Always Mean Growth
- Confirm the Metric Before You Use the Number
Headcount vs FTE at a Glance
Headcount counts people on the payroll, while full-time equivalent (FTE) counts how much paid work those people represent. Think of headcount as the names on a team sheet. FTE expresses the team's hours as standardized full-time workloads, or full-time work-years when measured annually.
Under the U.S. Bureau of Labor Statistics establishment-survey methodology, an employee counts if they received pay for any part of the pay period containing the 12th day of the month. A part-time employee therefore counts as a person, not as a fraction based on hours.
Headcount and FTE compared
| Measure | Headcount | FTE (full-time equivalent) |
|---|---|---|
| What it counts | Each person on payroll, counted once | Paid hours converted into full-time work-years |
| Part-time worker | Counts as one | Counts as a fraction, based on hours |
| Seasonal or temporary worker | Counts as one while on pay status | Counts by hours worked or paid |
| Basis | Number of employees at a reference date or period | Total hours divided by standard full-time hours |
| Example: 700 full-time and 300 half-time staff | 1,000 | 850 |
| Typical use | Company size, segmentation, benchmarking | Labor capacity, staffing cost, workforce planning |
In the hypothetical example, the full-time staff contribute their full workload, while the half-time staff contribute half of theirs. The organization has 1,000 people but 850 FTEs. Neither answer is more accurate in isolation, they answer different questions.
Match the measure to the decision
The OECD makes the same conceptual distinction between persons and standardized workload. The U.S. Congressional Research Service likewise distinguishes on-board employment, which counts employees in pay status, from FTE, which converts regular straight-time hours into work-years.
Don't interpret FTE as a measure of productivity, either. Equal hours don't guarantee equal output, and equal FTE totals don't guarantee equal payroll expenses when pay rates differ.
Practical rule: Use headcount for company size. Use FTE for labor capacity and as an input to staffing-cost calculations, alongside compensation and benefits.
How Headcount Is Counted Step by Step
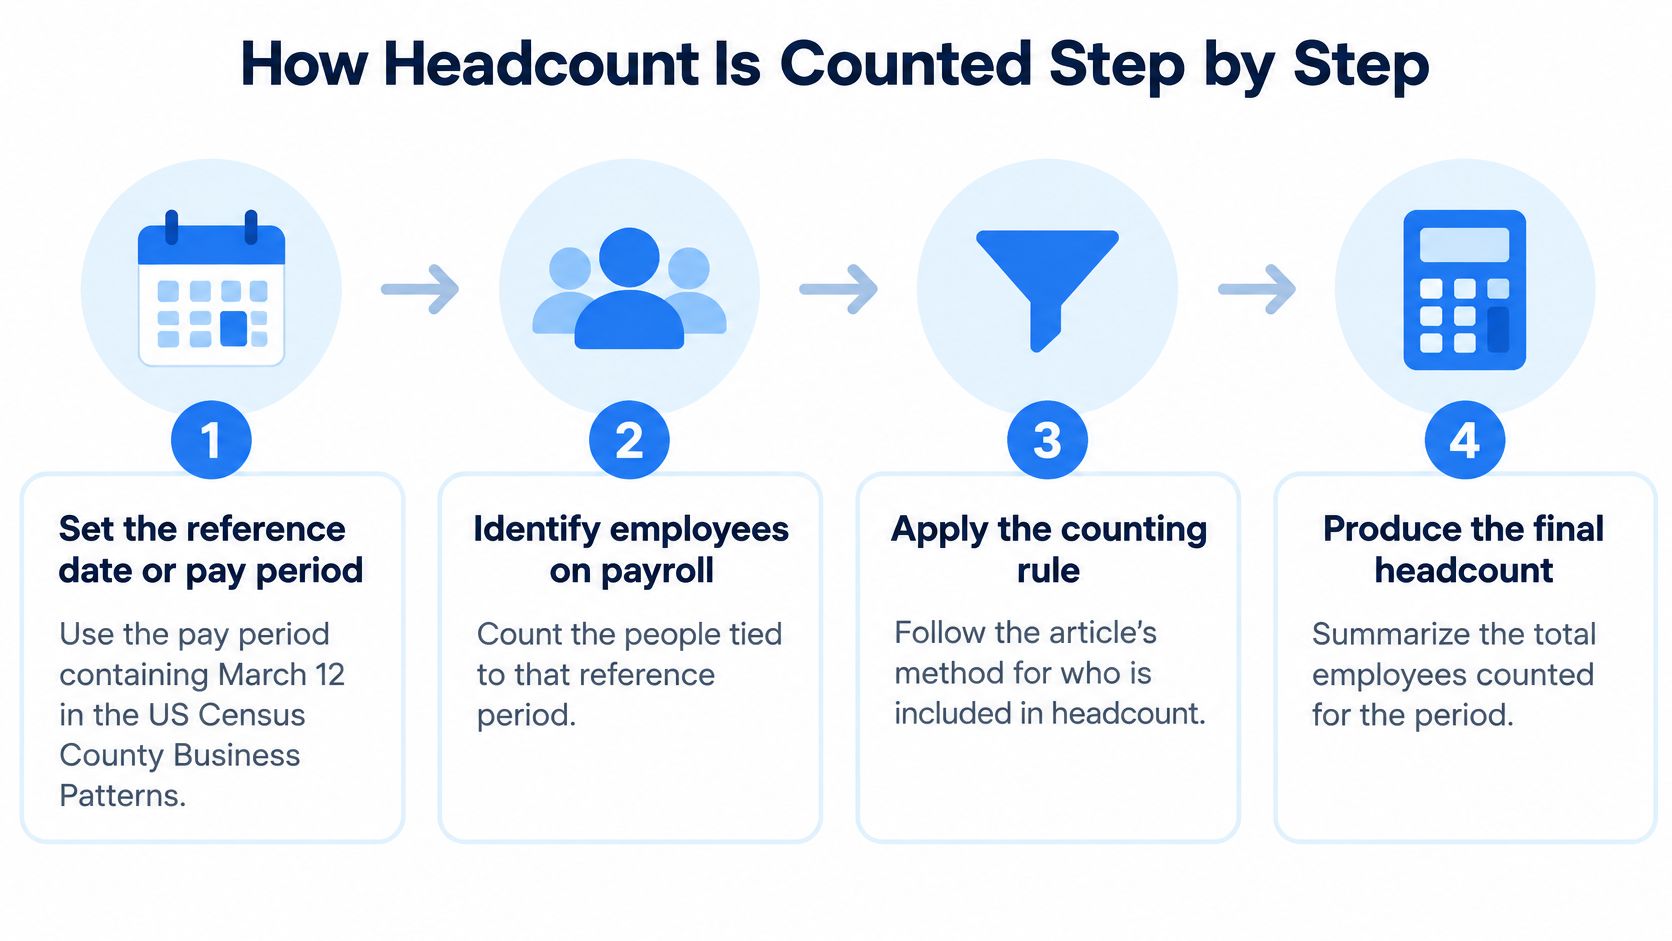
A dependable count starts with a rule, not a spreadsheet total. The U.S. Census Bureau's County Business Patterns program, published annually since 1964, measures employment during the pay period containing March 12 and organizes results by establishment, geography, industry, and employee-size class.
Use this process as a visual guide, then apply the detailed counting rules to your own roster.
Build an auditable count
Set the reference date or pay period. Decide whether you're measuring a snapshot or eligibility during a payroll period. Otherwise, people can enter or leave the roster while you're calculating.
Identify employees on payroll. Extract the eligible roster from your payroll or human resources system. For a pay-period measure, apply the rule for people who received pay during any part of that period.
Count each eligible person once. Use an employee identifier to remove duplicate records. Multiple assignments shouldn't automatically become multiple people in an internal enterprise count.
Assign employees to establishments. An establishment is a physical operating site, such as an office, store, or factory. Define how you'll assign remote workers and employees who split their time across locations.
Consolidate the enterprise total. An enterprise is the wider business that may contain multiple establishments. Reconcile site totals and shared assignments before producing the company-wide figure.
Create useful size bands. CBP uses establishment-size classes including 1 to 4, 5 to 9, 10 to 19, 20 to 49, 50 to 99, and 100 to 249 employees. Keep the underlying unit clear when using those bands for comparisons.
Save the context with the result. Record the reference period, geography, included entities, and counting method. Someone reviewing the figure later should be able to reproduce it.
A useful reconciliation check is to compare the eligible roster with payroll exceptions, such as recent departures and employees with multiple assignments. Investigate discrepancies rather than adjusting the total without an explanation.
For a complementary walkthrough, watch the employee-count explanation below.
Before comparing companies, confirm that their figures describe the same organizational scope and a comparable reference period.
What Changes the Number and Who Is Counted
Two companies can each report 1,000 employees and still have different workforces. One may also rely heavily on agency workers, while the other does not. The employee count records people within a defined boundary; it does not measure all labor available to the business.
That boundary depends on the purpose of the count. A direct employee, an agency placement, and an independent contractor are different worker categories. Contractors are generally reported separately, but organizations may define their workforce totals differently.
Resolve the boundary questions
- Employees on leave. Check whether the method counts people by employment status, paid status, or active work. Temporary absence does not necessarily remove someone from an employment-based count.
- Interns and temporary staff. Identify the employment arrangement. A direct employee, an agency placement, and an independent contractor may belong in different categories.
- Overseas workers. Define whether the figure covers a domestic entity, a region, or the global group.
- People who haven't started. An accepted offer is not the same as an employee who has started work. Keep planned hires separate unless the reporting definition includes them.
- Contractors. Track contingent workers separately so readers can distinguish employee headcount from the broader workforce.
Legal counts have their own boundaries. In the United States, employment-law coverage depends on the federal statute and the worker categories it covers. Check the governing rule's legal test before relying on a company headcount figure.
Two credible sources can report different totals because they count different groups. Compare their definitions before treating the difference as an error.
When recording headcount in firmographic data, or descriptive information about companies, preserve the definition, worker categories, observation date, and geography. Filings, internal records, professional profiles, and third-party estimates may use different boundaries, so choose the figure that matches the decision at hand.
Converting Headcount to FTE with Worked Examples
FTE = total weekly hours of all staff ÷ standard full-time weekly hours. Using a 40-hour workweek, add each employee's regular weekly hours, then divide the total by 40.
That denominator is a reporting convention, not a universal rule for every employer. The Texas FTE reporting guidance uses a 40-hour workweek and explains that any combination of employees totaling those hours can represent an FTE.
Worked headcount-to-FTE conversions
The following hypothetical examples use that convention.
| Headcount (people) | Hours per week each | Total weekly hours | Resulting FTE |
|---|---|---|---|
| 2 | 20 | 40 | 1.0 |
| 5 | 16 | 80 | 2.0 |
| 3 | 30 | 90 | 2.25 |
| 4 | 10 | 40 | 1.0 |
The first row shows why counting names can't establish available hours: two people working 20 hours each deliver the hours of a full-time position. In the second, five people working 16 hours each provide 80 hours, equivalent to two full-time positions.
The third example produces a fractional result. Three people working 30 hours each provide 90 hours, or 2.25 FTEs, so rounding the result to the number of people would distort the workload. The final row shows the reverse perspective: four people can collectively supply the hours of a single full-time role.
Keep the reporting period consistent
These weekly examples explain the arithmetic, but formal reporting may use a longer period. Texas distinguishes FTE based on hours worked or paid during a quarter from headcount measured on the quarter's last working day.
Use matching periods and document whether your numerator includes worked hours, paid hours, or regular scheduled hours. Don't combine a weekly roster with annual hours unless you deliberately convert both to the same basis.
Benefits budgeting also needs separate eligibility rules. For that part of workforce-cost planning, Benely's guide to understanding employer funded health FSAs is a useful companion, rather than a substitute for hours-based calculations.
If a company reports only its employee total, you can't recover FTE without hours information. Request the hours and the applicable full-time standard before comparing labor capacity.
Using Headcount in Product and GTM Workflows
Product teams and go-to-market (GTM) teams, which organize how a company reaches and serves customers, need actionable categories rather than misleading precision. Design each workflow around what the employee figure can safely support.
Choose the safeguard for each workflow
- CRM enrichment. A customer relationship management system may receive records containing only a name and email. Resolve the employer, then use a company URL or domain to add employer size, keeping the source and observation date beside the result.
- Account segmentation and routing. Group accounts into employee-size bands so sales representatives and assignment rules use the same tier. If an updated estimate crosses a territory boundary, require corroboration before reassigning ownership.
- Lead scoring. An ideal customer profile (ICP) describes the organizations best suited to your offering. Use size as a weighted input alongside fit signals such as industry, rather than making an uncertain estimate the sole qualification gate.
- Talent intelligence. For recruiting and sourcing, use employer size to contextualize hiring activity. Don't interpret a large workforce as proof that a company has approved recruitment spending.
Fetchin, a B2B data API, returns firmographics including headcount from a company URL or domain. Our services process only publicly available professional information, which may include names, job titles, company affiliations, and professional experience; store the returned value with the date you observed it.
Data obtained through our services may be displayed to end users, combined with your own data, and passed to customers within your product or API without separate written consent.
Implementation safeguard: Keep the original source value separate from the normalized band your routing rules use.
The BLS benchmark methodology offers a useful quality-control model by calibrating survey estimates against administrative employment records. In a product workflow, corroborate consequential changes with repeated observations or company disclosures.
For internal resourcing rather than account classification, MakeAutomation explains how to turn capacity forecasts into staffing decisions. That's a separate planning exercise from assigning a company-size tier.
Why a Rising Headcount Does Not Always Mean Growth
A company can add employees without increasing output, revenue, or the scale of its operations. Headcount is a dated count of people within a defined scope; it measures neither hours worked nor business capacity on its own.
For example, a company might move from 500 to 520 employees over a year while recording 200 exits. If there were no acquisitions, disposals, or changes in how workers were classified, it hired 220 people: 200 to replace departures and 20 to increase the total. The net gain is modest, while the movement beneath it is substantial.
Those exits equal 40% of the opening workforce. That is not necessarily the formal turnover rate, which may use average employment as its denominator. It does show why a before-and-after headcount alone can hide considerable hiring and departure activity.
Separate net change from workforce movement
| Observed pattern | A possible explanation to investigate |
|---|---|
| Flat employee count | Departures offset by replacement hiring |
| Rising employee count | Contractor work moved onto employee payroll |
| Falling employee count | Deliberate role redesign or automation |
| Rising count after an acquisition | Added organizational scope rather than organic hiring |
Use hires and exits alongside the net difference to understand workforce activity. Department, geography, seniority, and job-posting mix can help show where change is occurring, but a rising total by itself does not establish that the company is growing.
For broader context, explore recruitment statistics, while keeping external benchmarks separate from a company's own history. A time series, meaning comparable observations across successive dates, can reveal whether a change persists. Check that the reporting scope stays consistent before comparing counts.
Treat headcount as a dated signal, not a standalone measure of company health or growth.
Confirm the Metric Before You Use the Number
Choose the field that answers the decision, then preserve enough context for another person to check your reasoning. A tidy database isn't reliable if its employee fields mix incompatible measures.
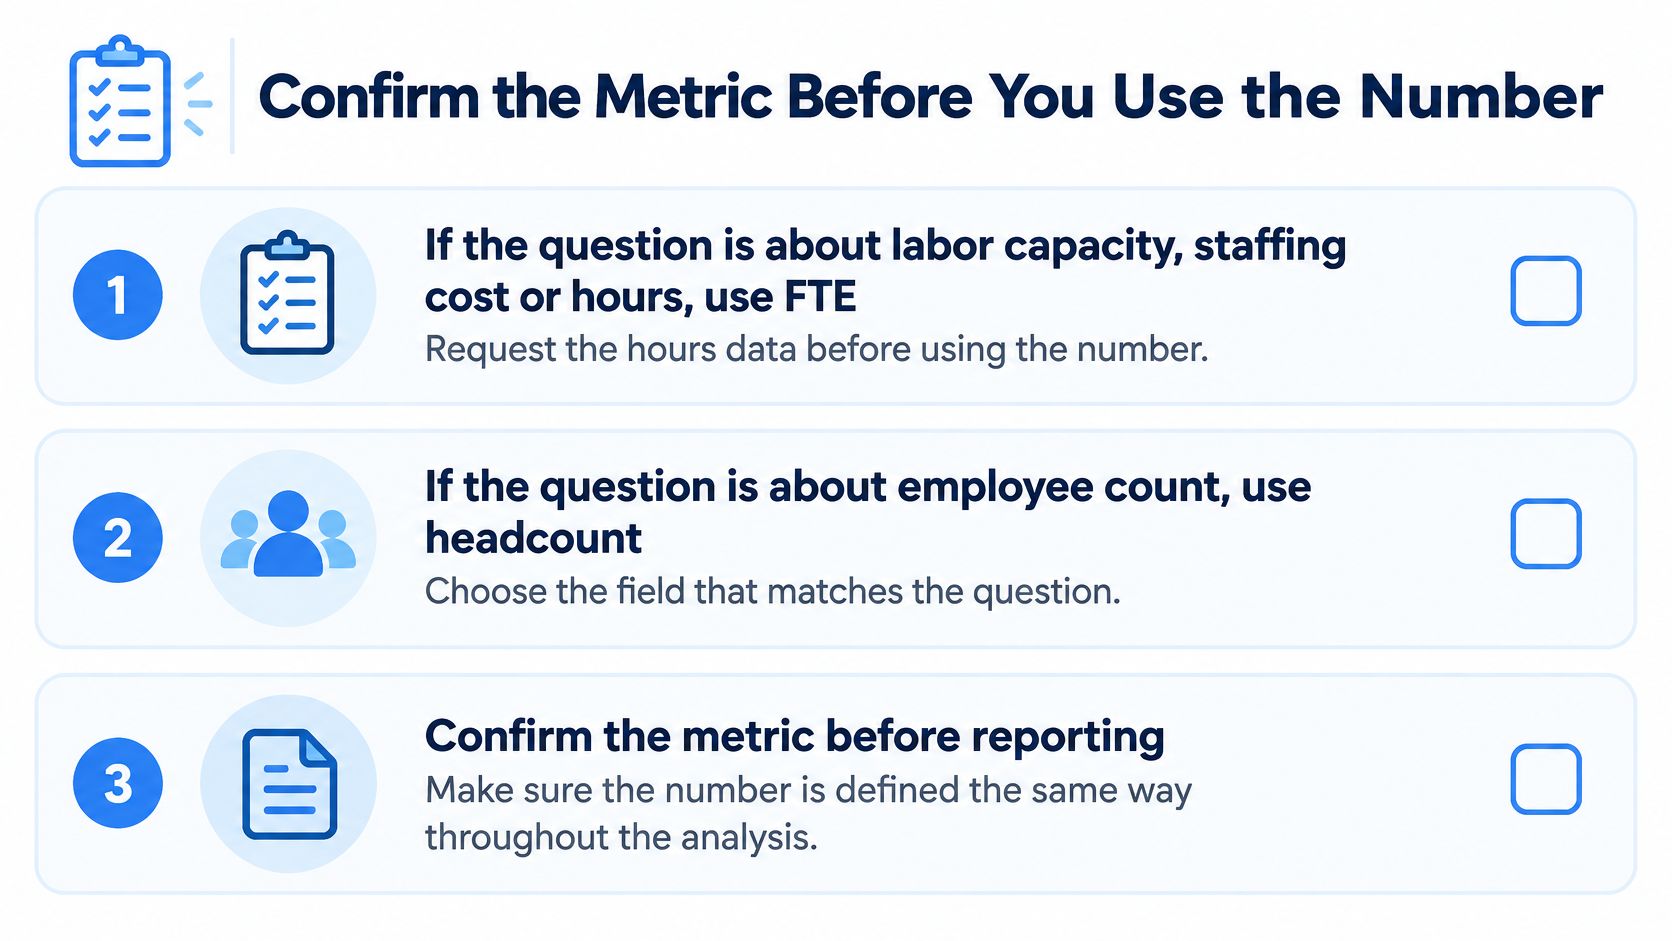
Use this checklist before reporting or automating a workforce decision.
Make the record decision-ready
- For capacity or staffing cost, request hours. Use FTE with the appropriate compensation inputs. Record the full-time denominator, reporting period, and included hours.
- For company-size classification, use a band. Save the observation date and entity scope so account tiers remain interpretable.
- For legal coverage, apply the governing rule. Record the jurisdiction, worker categories, and historical counting period rather than relying on a current total.
- For consequential actions, corroborate the signal. Keep supporting evidence before changing territory ownership or account-size qualification.
- For aging records, schedule a refresh. Define a refresh window based on how the field is used, then re-check records that exceed it.
Data hygiene means maintaining usable, current records, including scheduled re-enrichment of a stale database to catch job changes. A documented data freshness policy should distinguish when you retrieved a record from when its underlying workforce figure was measured.
Update your data model next: confirm metric type, date, and scope; store estimated headcount as a range with a confidence value; and schedule its next check.
Fetchin offers company enrichment that fetches firmographics, including headcount, from a company URL or domain for use in your own product. Visit Fetchin to connect company-size data to your enrichment workflow, and pair each result with the dates and scope your decisions require.