The most popular advice about performance benchmarking is also the least useful: find an industry score, compare your number with it, and aim to move upward. That approach turns measurement into a scoreboard race. A better answer to what is performance benchmarking starts with a decision, a realistic workload, and a repeatable method for comparing results.
A benchmark doesn't tell you whether a system is “fast” in the abstract. It tells you how a defined system performs when it handles a defined task under defined conditions. That distinction matters for SaaS products, data APIs, infrastructure choices, hiring funnels, and AI features alike. The result is only as credible as the rules behind the test.
Table of Contents
- Why Performance Benchmarking Is Harder Than It Looks
- The Three Benchmark Types That Actually Matter
- Core Metrics That Make a Benchmark Trustworthy
- Tools, Data Sources, and Where Real-Time APIs Fit
- Implementing Benchmarking Step by Step in Your Team
- Benchmarking in 2026, AI Workloads and Continuous Cycles
- Practical Checklist and When to Bring in Specialists
Why Performance Benchmarking Is Harder Than It Looks
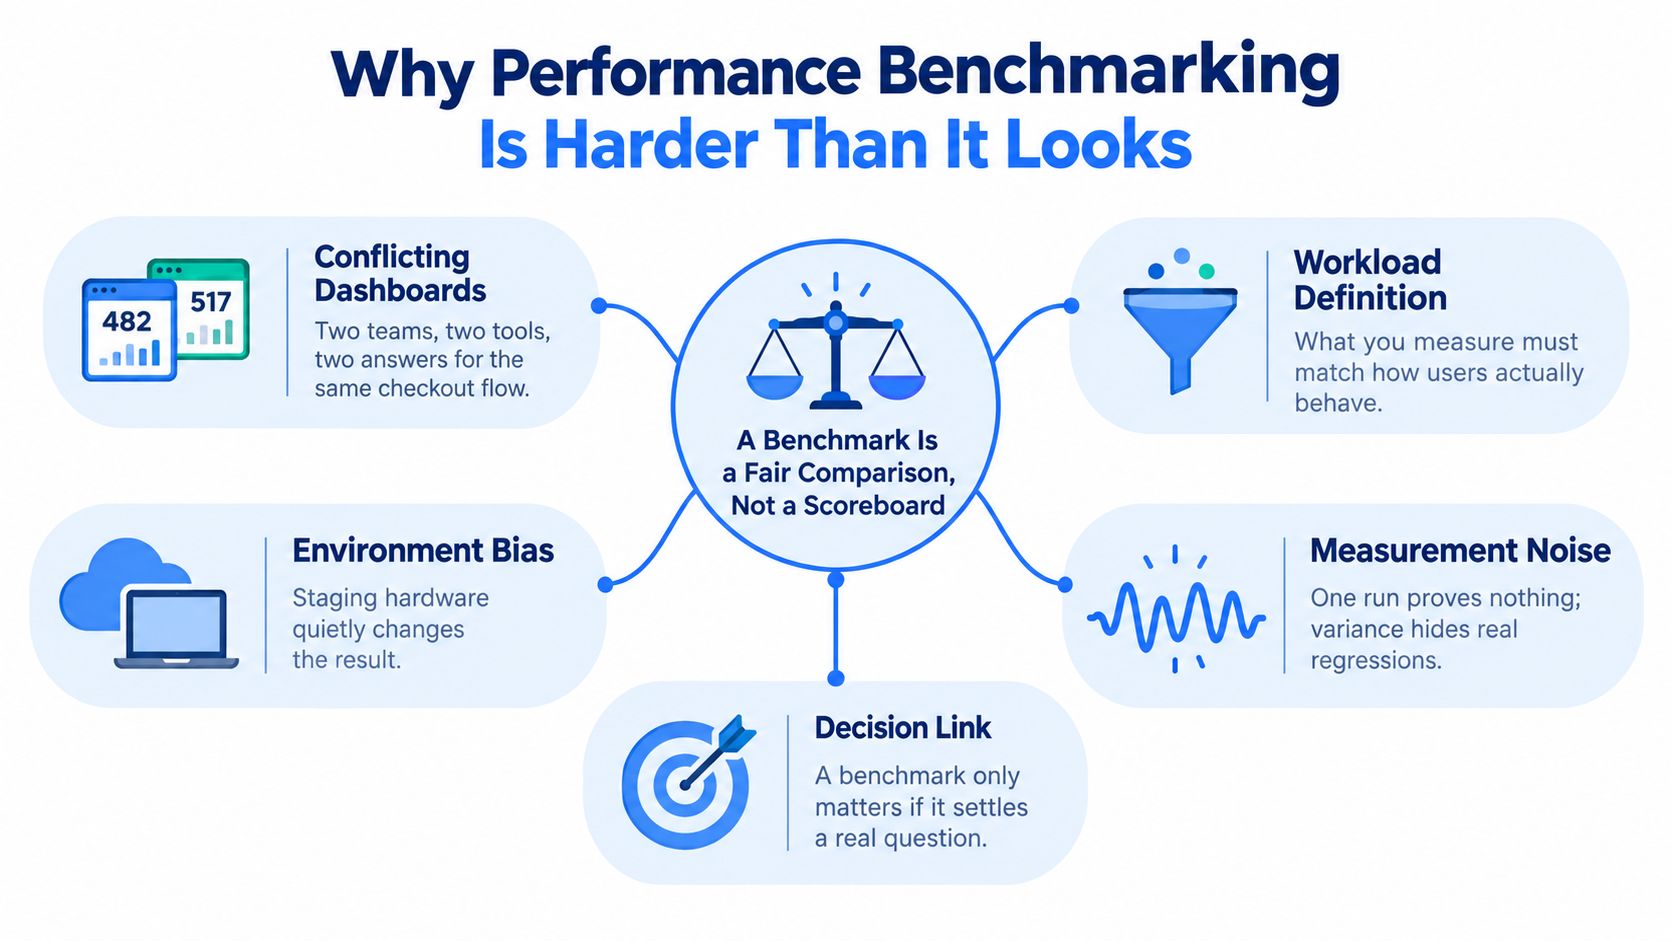
Two engineering leads are arguing about whose checkout flow is faster. One opens a dashboard showing a low response time. The other shares a monitoring report with a worse number and insists that the first team measured the wrong thing. Both dashboards look professional. Both contain real measurements. They still disagree because the tests used different traffic patterns, regions, environments, or definitions of success.
A useful benchmark works more like a kitchen recipe than a single score. If two cooks prepare the same dish, they need the same ingredients, quantities, cooking temperature, and timing before anyone can compare the results fairly. In formal terms, benchmark testing evaluates a hardware, software, or system configuration by running a standardized workload and measuring quantitative outcomes such as latency, throughput, and resource utilization. The method should also record how the measurements were collected so another team can reproduce them, as described in this benchmark testing guide.
The comparison can fail before the test starts
Teams often compare unlike conditions without noticing it. One checkout test may use a warm cache and a narrow geography, while another starts cold, includes more complex customer records, or runs on different hardware. A test from a laptop or staging environment can also produce a very different result from production infrastructure.
Three traps appear repeatedly:
- The wrong baseline: A company compares itself with a famous enterprise, even though the products serve different users and workloads. A peer benchmark needs a genuinely comparable cohort.
- The wrong moment: A team measures immediately after a release, during a quiet period, or at an unusual traffic peak, then treats that run as representative.
- The wrong label: “Industry standard” sounds precise, but the label means little unless the workload, metric, environment, and collection rules are documented.
The historical development of benchmarking shows why these details matter. Xerox used benchmarking in 1979 to compare manufacturing processes with Japanese competitors. The period is often associated with Xerox's copier share falling from 86% in 1974 to 17% in 1984, while profits fell from about $1 billion to $290 million, as documented in this history of performance benchmarking. In computing, Whetstone appeared in 1976, LINPACK in 1979, SPEC was founded in 1988, and TOP500 launched in 1993, helping move comparison toward standardized workloads rather than rough specifications.
Practical rule: A benchmark is a measurement protocol that answers a specific question. It isn't a mood, a dashboard screenshot, or a number without conditions.
The naive interpretation is that the highest score wins. The more reliable interpretation is that a benchmark creates a fair comparison only when the workload and rules remain stable. The research on benchmark methodology describes the field's movement away from simplistic indicators such as clock speed, memory size, MIPS, or MFLOPS and toward representative, domain-specific, multi-metric tests. Real performance depends on the work a system performs, not only on what its specification sheet promises.
The Three Benchmark Types That Actually Matter
The right benchmark depends on the question behind it. A SaaS company deciding whether it is competitive needs a different reference point from a team investigating a regression in its own API. Treating every comparison as the same exercise creates false confidence.
| Type | Question It Answers | SaaS Example | Common Trap |
|---|---|---|---|
| Peer | How do we perform against comparable organizations or systems? | Compare checkout latency with a matched competitor cohort under similar conditions. | Choosing a cohort with different traffic, product complexity, or infrastructure. |
| Historical | How has our performance changed over time? | Compare the current API response profile with the previous quarter's documented run. | Changing the workload or environment, then calling the difference improvement. |
| Absolute | Do we meet a fixed requirement or theoretical boundary? | Test throughput against a contractual service-level objective or documented SLA. | Treating compliance with the threshold as proof of superior real-world performance. |
Peer benchmarking gives market context
Peer benchmarking answers a positioning question. A workflow platform might compare its checkout latency with similar SaaS products, or a talent intelligence service might compare the completeness of its matching pipeline with comparable providers. The comparison becomes useful only when the cohort, workload, geography, data volume, and test conditions are aligned.
A peer result can show that a product is behind its market group, but it can't explain why. The cause may be architecture, configuration, traffic composition, or measurement design. Peer benchmarking is therefore a context tool, not a diagnosis by itself.
Historical benchmarking exposes drift
Historical benchmarking compares a current run with the organization's own earlier result. It's the best choice for detecting regressions after a code change, a database migration, a pricing-tier adjustment, or a change to an enrichment workflow.
Suppose an API endpoint responds more slowly than it did in the previous quarter. That comparison gives the engineering team a useful signal, provided the endpoint, input distribution, environment, and collection method remain comparable. It can reveal drift even when the product still meets its external target.
Absolute benchmarking tests a boundary
Absolute benchmarking asks whether a system meets a fixed requirement. The reference might be an SLO, a contractual SLA, a capacity ceiling, or a documented technical limit. The question isn't “are we better than the market?” It's “do we satisfy the condition we promised or require?”
Mixing the types produces misleading conclusions. A product can improve against its own past while still lagging peers. It can meet an SLA while consuming too many resources to support a profitable pricing tier. It can beat a peer score while failing a critical contractual threshold.
Choose peer benchmarks for market position, historical benchmarks for change over time, and absolute benchmarks for requirements. Name the question before selecting the comparison.
The distinction between KPIs and benchmarks reinforces this rule. A KPI tracks progress toward an internal objective, while a benchmark provides an external or historical reference point, as explained in this benchmarking glossary. A team needs both, but it shouldn't treat them as interchangeable.
Core Metrics That Make a Benchmark Trustworthy
A restaurant can serve one customer quickly and still fail when a queue forms. A motorway can move a large number of cars while individual journeys remain slow. These analogies separate the two metrics that people confuse most often, response time and throughput.
Response time is how long one request takes to complete. Throughput is how many requests or transactions finish during a unit of time. In a SaaS product, response time describes the experience of one user waiting for a page or API call. Throughput describes how much work the service can process while demand continues.
The four core metrics below give teams a more complete view:
- Response time: Measures waiting time for an individual request. Use it when evaluating user experience, endpoint behavior, or an SLA tied to request completion.
- Throughput: Measures completed work under load. Use it when sizing infrastructure, comparing processing designs, or estimating how much demand a service can handle.
- Utilization: Shows how much available capacity is busy. High utilization may indicate efficient use of infrastructure, but it can also leave little room for bursts.
- Resource consumption: Tracks the resources required to deliver the result, such as CPU, memory, bandwidth, or operating cost. A faster design may still be unattractive if it consumes disproportionate resources.
Technical guidance commonly treats response time, throughput, utilization, and resource consumption as the core measures because controlled comparisons need more than an overall impression of speed. Holding hardware, software, configuration, and workload constant helps teams isolate bottlenecks, as this technical performance benchmarking paper explains.
Averages hide the experience at the edges
An average response time can look healthy while a meaningful portion of requests takes much longer. Report a distribution, not only an average. The p50 represents the midpoint experience, while p99 shows the slow edge of the distribution. Those figures answer different operational questions.
If p50 improves but p99 worsens, most users may see a faster service while a smaller group encounters serious delays. That could affect large accounts, complex records, specific regions, or requests that trigger expensive processing. If both improve, the team has stronger evidence that the change helped broadly.
Load tests should also reflect realistic demand. A test based on an arbitrary virtual-user count may not represent normal traffic or a known business peak. This guide to benchmark testing distinguishes response time from throughput and recommends using traffic patterns that resemble actual demand.
Metrics should support a decision
A product manager choosing a service tier may care about p95 or p99 latency and cost per request. An infrastructure lead may prioritize throughput, CPU utilization, and memory pressure. A procurement team may need a fair comparison between providers under a documented workload.
Don't collect every available metric without deciding how you'll use it. Teams working on delivery efficiency can also consult this practical guide to shipping faster without risk. For an API, document rate-limit behavior separately from response performance, using this explanation of API rate limits as a reference point.
A trustworthy result connects the metric to an action. If no one knows what to do when p99 rises, throughput falls, or resource consumption exceeds the budget, the dashboard is observing performance rather than managing it.
Tools, Data Sources, and Where Real-Time APIs Fit
Benchmarking tools fall into categories, and each category answers a different question. A synthetic platform can tell you whether a scripted checkout flow is slow from a chosen region today. An observability stack can show what production customers experienced. An industry dataset can frame a board discussion, while a real-time public data API can provide current external records for a comparison or workflow.
| Category | Data Source | Update Cadence | Best Fit |
|---|---|---|---|
| Synthetic tests | Scripted requests from controlled locations and environments | On demand or release-based | Release gates, regression checks, and repeatable route tests |
| Observability stacks | Production telemetry from real sessions and services | Continuous | Diagnosing live customer experience and operational bottlenecks |
| Industry reports | Aggregated external studies or consortium datasets | Periodic | Market framing and strategic reference points |
| Real-time public data APIs | On-demand data fetched from external public pages or services | Per request or workflow | Current peer, company, talent, and market comparisons |
Synthetic tests create control
Synthetic testing is valuable because the team controls the route, location, browser or client, input data, and timing. That control makes repeated runs easier to compare and is useful for release gates. It also creates a blind spot: scripted behavior may not capture the diversity of real users, devices, records, or network conditions.
Observability provides the opposite perspective. It captures actual production behavior and can expose slow regions, expensive endpoints, and unusual request patterns. Its results describe your own traffic, though, so it doesn't automatically provide a neutral peer comparison.
External data adds context
Industry reports can supply a common reference for leadership teams, but publication cycles introduce delay. A report may be well designed and still be too old for a fast-moving product decision. Public data APIs can fill a different gap by fetching current, structured information when a team needs it.
For example, a SaaS product may compare company attributes across a selected cohort, or a talent platform may evaluate the freshness and completeness of public professional records used in a matching workflow. A B2B data API such as Fetchin fetches public professional and company information from supplied URLs and returns structured JSON, making it possible to integrate current external data into a benchmark workflow instead of waiting for a periodic file.
The API isn't a replacement for a controlled performance test. It is a data source that can support the population and comparison layer around that test. Teams still need to define the cohort, fields, collection rules, and interpretation.
Match cadence to decision speed
A release gate needs a repeatable synthetic run. A live incident needs production telemetry. A strategic market review may tolerate a periodic report, while a product that depends on current company or talent data may need on-demand extraction. Teams can use a structured JSON data API when consistent machine-readable records are part of the measurement process.
Use one source for control and another for reality whenever the decision carries material risk. A controlled test tells you what changed under fixed conditions. Production or external data tells you whether that change matters outside the test.
Implementing Benchmarking Step by Step in Your Team
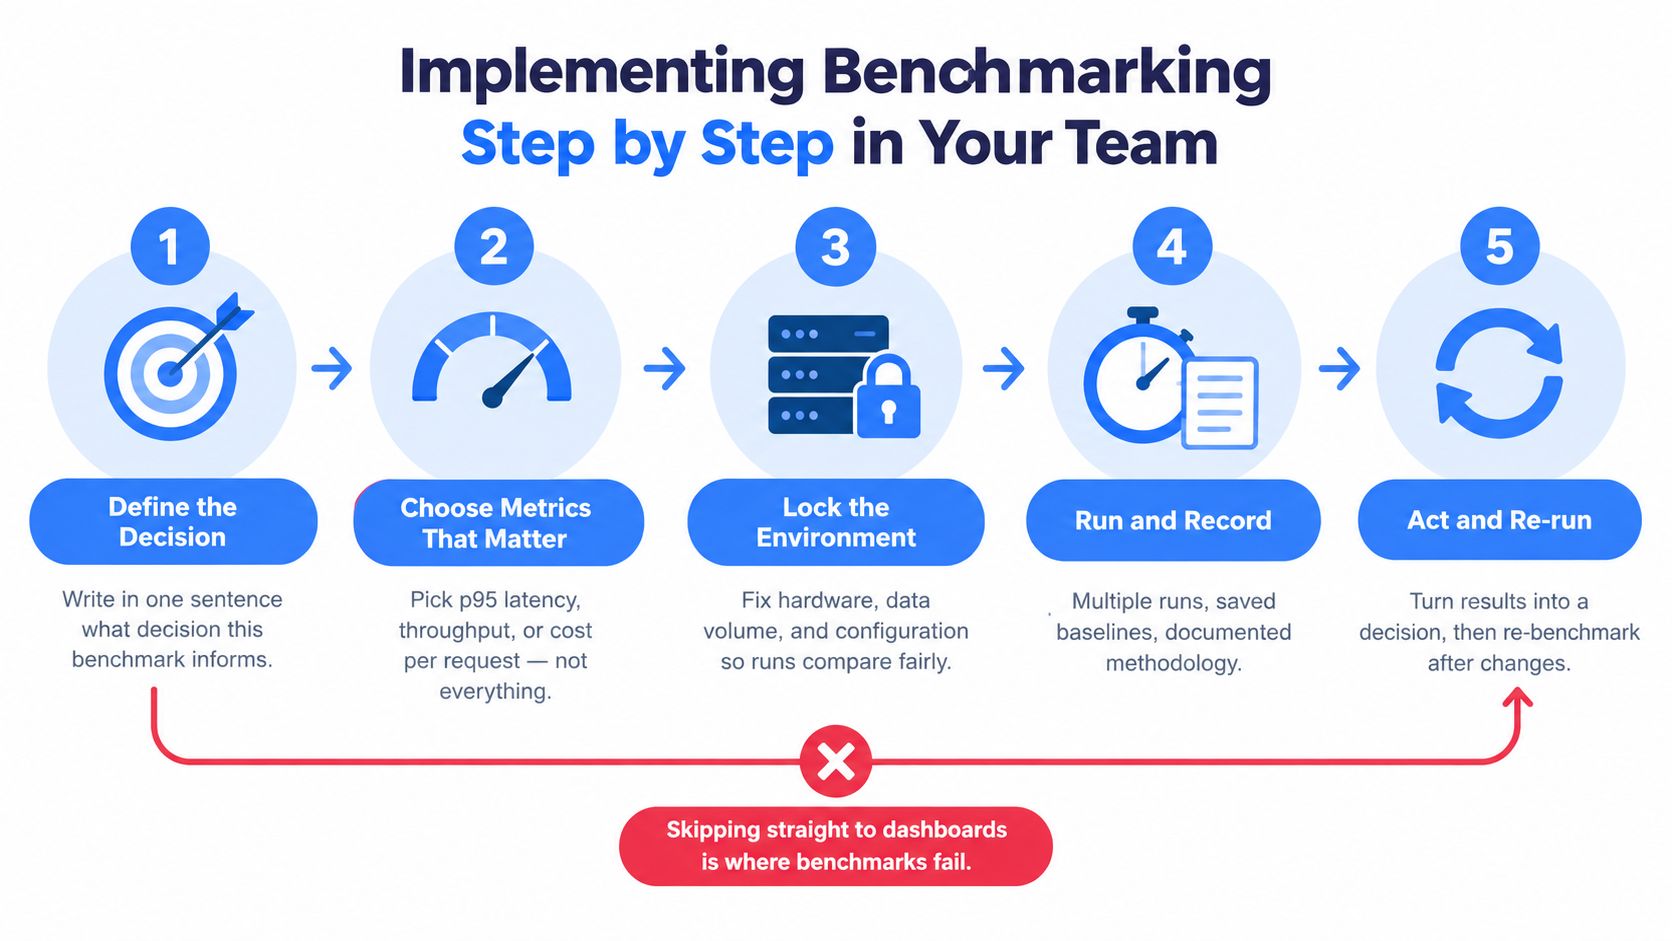
A benchmark often fails because someone opens a dashboard before defining the question. “Are we fast?” isn't a decision. “Should we release this checkout change to the enterprise tier?” is a decision that a benchmark can inform.
Start with the decision and unit
Write the decision in one sentence. Then define exactly what will be compared:
- A single endpoint: Useful for isolating API behavior.
- A complete funnel: Useful when users experience several dependent steps.
- A talent workflow: Useful for measuring a hiring or matching process.
- A unit of cost: Useful for comparing cost per inference request or enrichment operation.
Choose the metric set, population, and time window before collecting data. This prevents the team from changing the rules after seeing an inconvenient result. A benchmark methodology should specify representative workloads, comparability, granularity, and precision, principles outlined in this benchmarking methodology research.
Lock the conditions before running
Record the hardware, software version, configuration, data volume, geography, request mix, and traffic pattern. If the test concerns a SaaS feature, include the user actions that create the workload. If it concerns talent data, define which fields count as complete and how the population is selected.
Run a baseline before making the change. Save the raw results, summary statistics, methodology, and known sources of variance. Repeat the run where practical, because one observation can't distinguish a regression from ordinary measurement noise.
A synchronous API call and an asynchronous workflow can also produce different timing questions. Decide which behavior matches the user experience, then use this guide to compare synchronous and asynchronous APIs when choosing the test design.
Publish an interpretation, not just a score
A useful report includes the question, benchmark type, workload, environment, metrics, comparison reference, result, uncertainty, and recommendation. It names an owner and a re-test date. The report should say what the team will do, not merely whether a line moved upward.
The video below offers another visual explanation of benchmark implementation and measurement discipline.
A benchmark without an owner becomes shelf art. A benchmark with an owner, a documented method, and a scheduled re-test becomes part of product operations.
Benchmarking in 2026, AI Workloads and Continuous Cycles
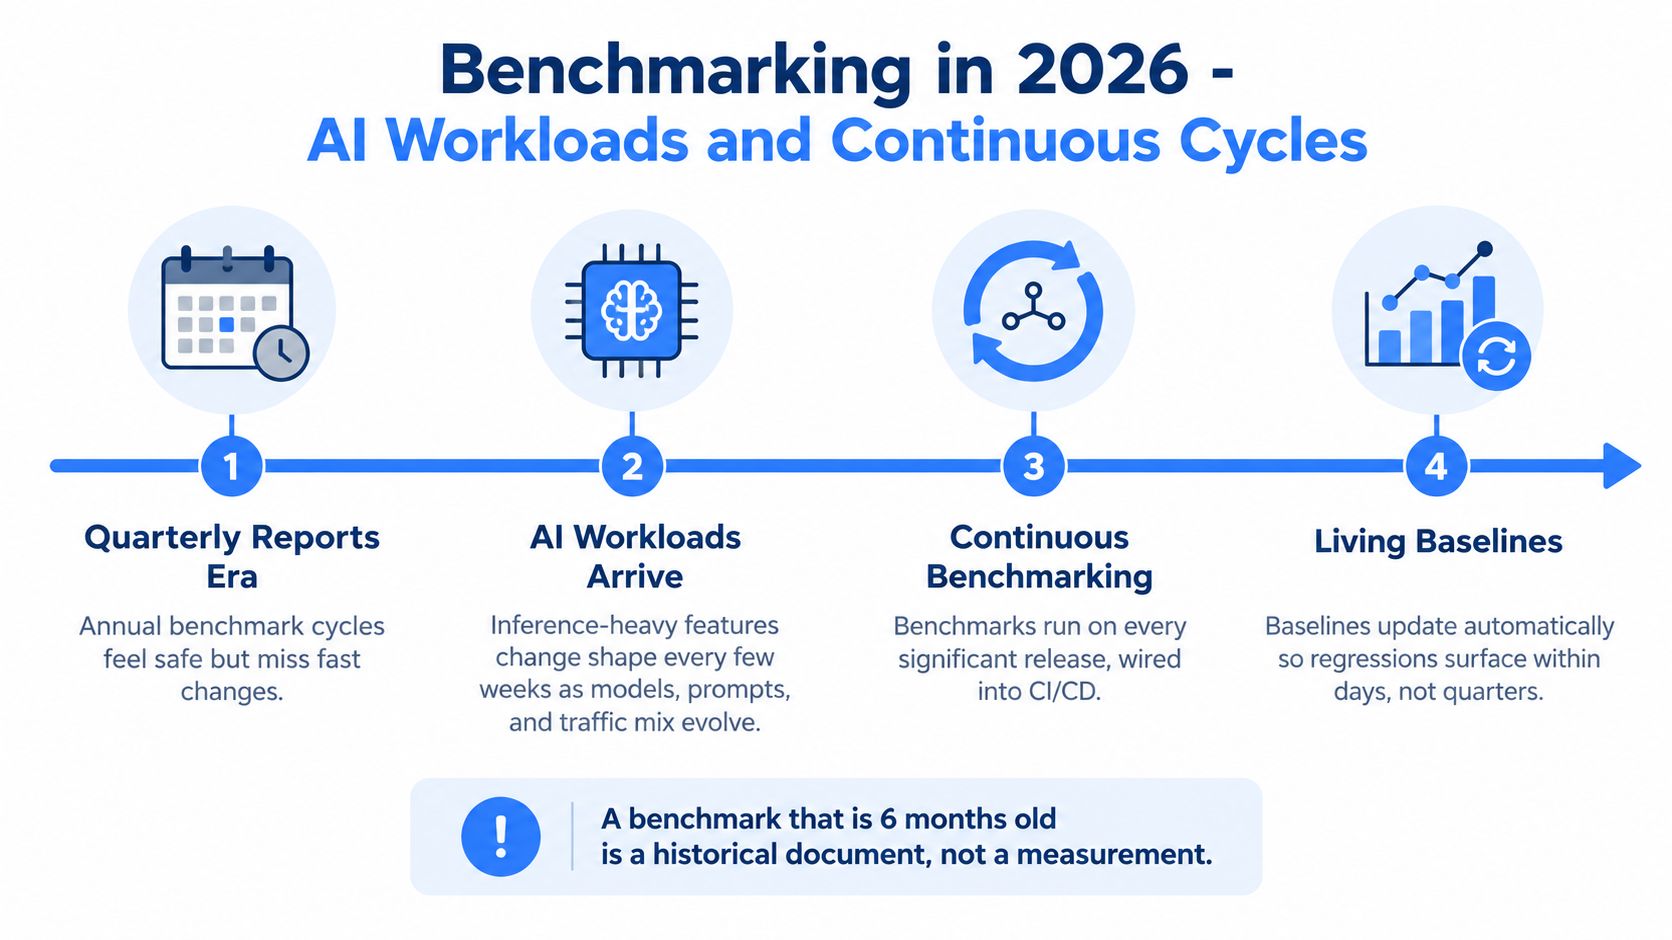
The annual benchmark is becoming a poor fit for AI-enabled products. Inference-heavy features change as teams adjust models, prompts, routing layers, context windows, and traffic mixtures. A result captured before those changes may describe a workload that no longer exists.
Guidance published for the 2025 to 2026 period frames benchmarking as a more continuously updated process, with objective definitions that remain usable as hardware and software change, as discussed in this benchmarking resource. The important shift is running tests more often. It's versioning the workload so the team can tell whether a result changed because the system improved or because the work changed.
Treat workload change as a measured variable
An AI benchmark should record the model version, prompt family, input characteristics, routing logic, output expectations, concurrency pattern, and relevant cost measures. Without those details, a single latency number can hide a major change in user behavior or computation.
The same principle applies beyond AI. A company that changes its customer mix, record complexity, geography, or endpoint behavior may no longer be running the original benchmark. The team should either preserve the old workload for historical comparison or create a new benchmark definition and clearly label the break.
Current beats definitive
Teams often want one definitive best-in-class score. That score is attractive because it appears final, but it loses value when the underlying workload moves. A continuously maintained baseline is less glamorous and more useful. It tells engineers whether the current release behaves acceptably against a known, versioned reference.
A benchmark is current only when its workload, environment, and interpretation still match the decision it supports.
Continuous benchmarking doesn't mean every trivial change requires a full campaign. It means significant releases, model changes, infrastructure changes, and workload shifts should trigger a deliberate re-test. The result should live alongside code or configuration, with a clear history of what changed and why.
Practical Checklist and When to Bring in Specialists
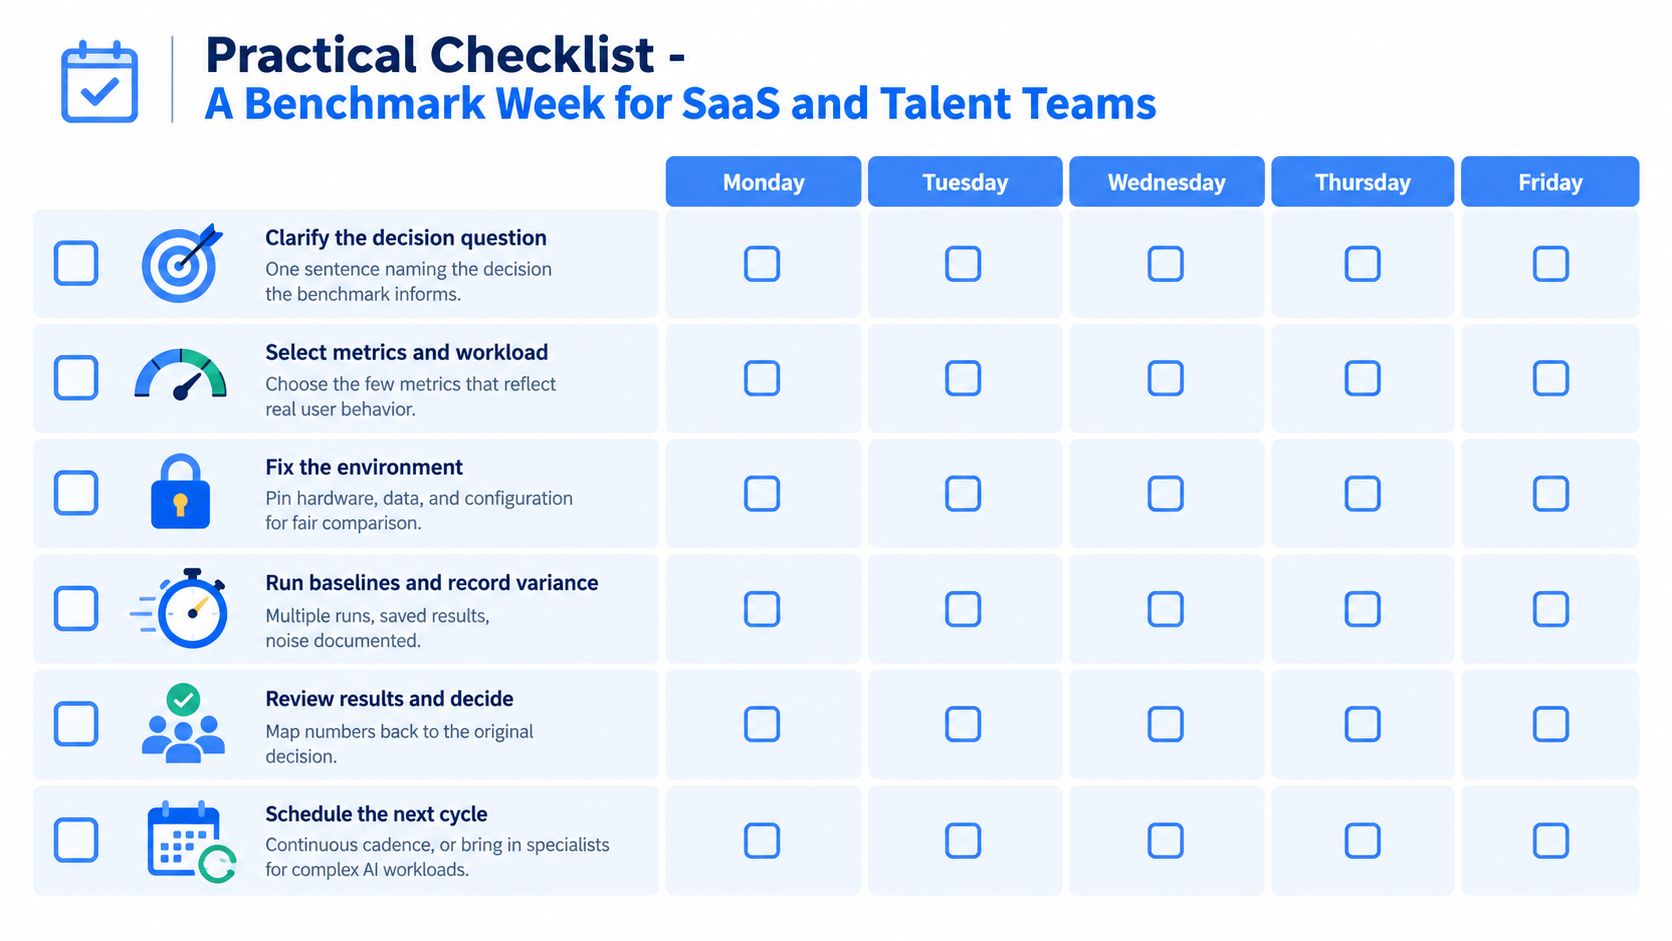
A SaaS or talent team can run a useful benchmark during a focused working week if it keeps the scope narrow. The checklist below turns the discipline into a sequence of decisions rather than a collection of dashboards.
- Clarify the decision: Write the action the result will inform. Sanity check: if the sentence only says “measure performance,” it isn't specific enough.
- Select the benchmark type: Choose peer, historical, or absolute. Sanity check: don't compare an internal improvement with a market claim as if they were the same reference.
- Define metrics and workload: Select the few measures that reflect real behavior. Sanity check: reject vanity metrics that don't connect to user experience, capacity, reliability, or cost.
- Choose the data source: Match synthetic tests, production telemetry, external reports, or real-time public data to the question. Sanity check: confirm that the update cadence fits the decision.
- Lock and run: Fix the environment, record the method, establish a baseline, and document variance. Sanity check: don't move the goalposts after seeing the first result.
- Interpret and schedule: Publish a recommendation, assign an owner, and set the next measurement date. Sanity check: a raw number without an action isn't a completed benchmark.
Bring in a specialist when peer comparisons are inconclusive, measurement noise exceeds the threshold your decision can tolerate, or the result will influence regulation, compensation, procurement, or customer commitments. AI workload benchmarks also deserve extra care when latency and cost shift with model or traffic changes. An independent data provider, benchmarking specialist, or fractional analytics lead can challenge the setup before the organization acts on a misleading result.
The practical test is simple: can another person understand what was measured, reproduce it, and connect the result to a decision? If not, improve the protocol before improving the score.
Fetchin provides a real-time B2B data API that fetches public professional and company data from URLs and returns structured JSON for SaaS, talent intelligence, and automation workflows. Use Fetchin to add current external data to your benchmark populations and build a repeatable comparison process around the decisions your team needs to make.