Sales volume is the number of units sold in a reporting period, not the money earned, and it's always tied to a specific time window. A business selling 4,000 units in six months has a sales volume of 4,000 for that period, whether customers paid with cash or credit.
That distinction matters when a team is reviewing a busy sales period. Revenue may look healthy, but managers still need to know whether customers bought more items, whether a particular product moved faster, and whether returns changed the final count. Units reveal demand and throughput, while pricing determines how much money those units generate.
Table of Contents
- Introduction to Sales Volume and Why It Matters
- What Sales Volume Really Means
- How Sales Volume Differs From Revenue
- How to Calculate Sales Volume With Formulas
- Common Variants and Real World Examples
- Key Takeaways for Tracking Sales Volume Effectively
Introduction to Sales Volume and Why It Matters
A sales manager checks the dashboard and sees that revenue has increased. The operations team, however, is asking a different question: did the business sell more products, or did it charge more for roughly the same number of orders? Without a unit count, those two situations can look identical from a distance.
Sales volume gives the team a direct view of how much product or service moved during a defined period. That information helps sales leaders evaluate customer preference, production teams plan inventory, and finance teams separate pricing effects from underlying demand. A business can compare volume across periods, products, regions, and channels without treating every price change as a demand change.
A VP of Sales might use volume to review territory performance, while a product manager might use it to decide which items deserve more inventory. Teams building a reliable reporting process can also review how HelpWithMetrics fixes metric governance so definitions stay consistent across dashboards and departments. For leadership responsibilities and measurement priorities, the VP of Sales job description offers useful context about the decisions sales leaders make.
The important questions are practical. What counts as a unit? Which period should the report cover? Should returns and cancellations reduce the total? Once those choices are explicit, sales volume becomes a dependable demand lens instead of a vague label attached to a sales report.
What Sales Volume Really Means
Start with a simple shop analogy. A shelf manager counts the items that leave the shelf during the day. The cash register records the money collected. Both figures matter, but they answer different questions.
In business terms, sales volume is the total number of units sold during a chosen reporting period. AccountingTools describes sales volume as a quantity measure rather than the monetary value of sales, which is why a report must identify both the item count and the period being measured (AccountingTools defines sales volume by units sold in a period).
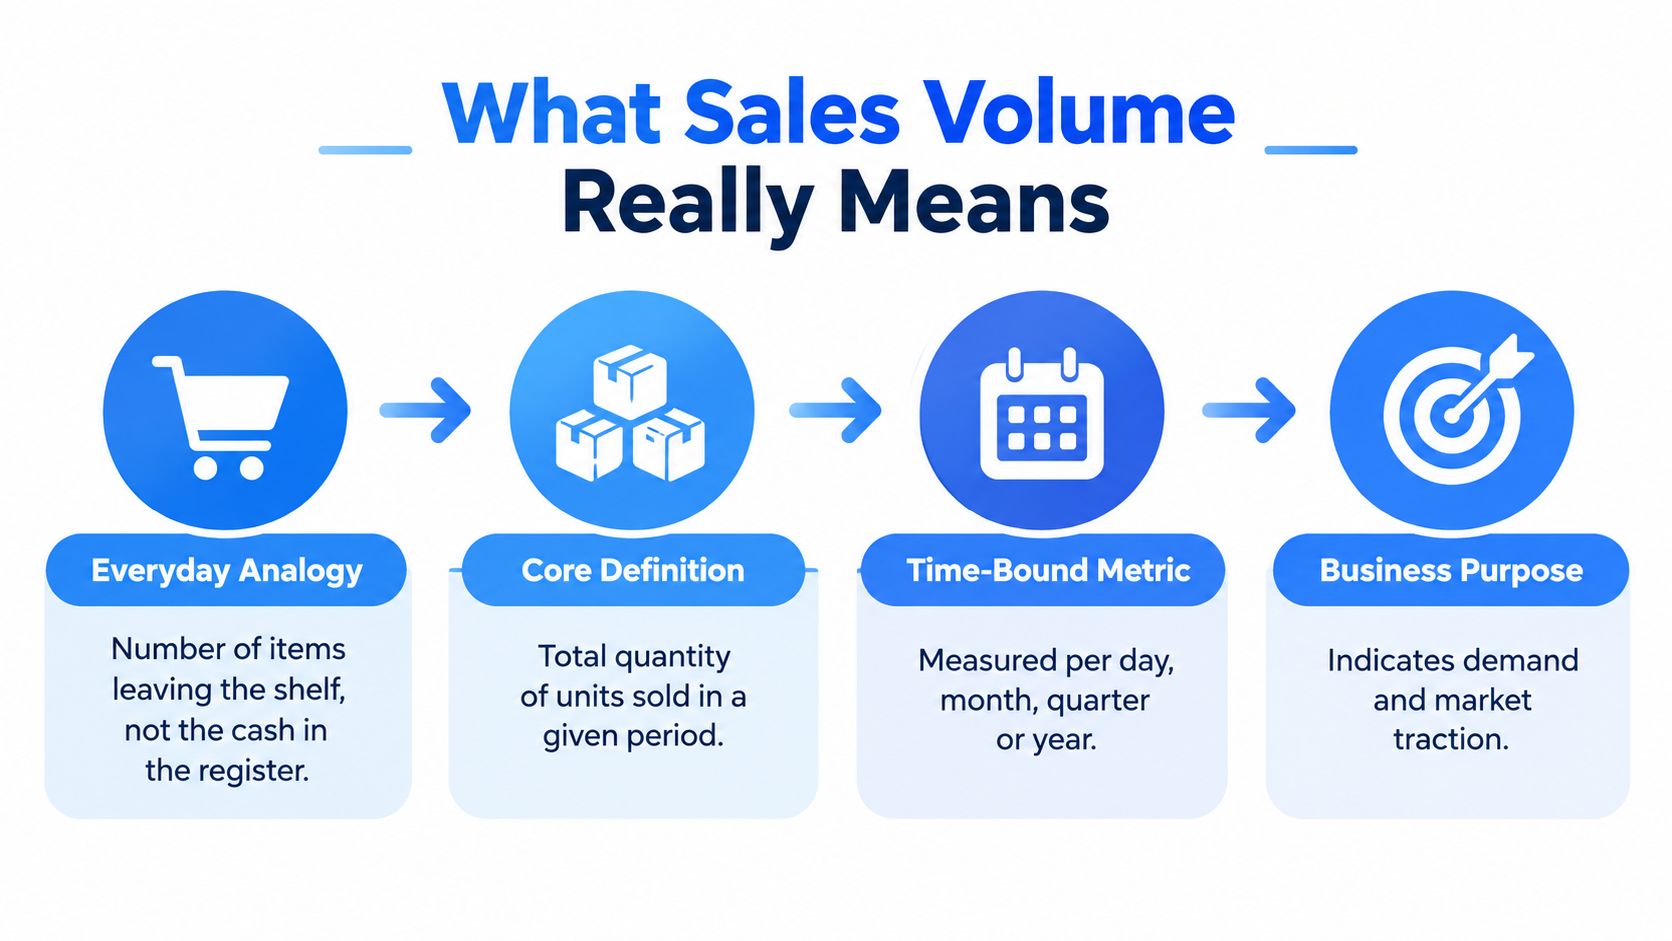
Three decisions make the definition usable:
- Counting unit: Decide whether the report counts physical products, contracts, subscriptions, seats, service packages, or another business-defined unit.
- Time window: Specify whether the measure covers a day, week, month, quarter, six months, or year.
- Adjustment policy: State whether returns, refunds, cancellations, and channel corrections are removed from the count.
A company selling 4,000 units in six months therefore reports sales volume of 4,000 for that period. The same company might report a different figure for a week or month because the measurement window has changed. Eurostat's official trade dataset, “Turnover and volume of sales in wholesale and retail trade,” identified as sts_trtu_m and assigned DOI 10.2908/sts_trtu_m, shows that volume is also used as a formal variable in economic trade measurement (Eurostat's trade volume dataset).
Practical rule: Never publish a volume figure without naming the unit, period, and return treatment.
This precision helps analysts compare demand across products and channels while keeping price effects separate. If one product becomes more expensive, its unit volume still describes how many customers bought it, not how much money those purchases produced.
How Sales Volume Differs From Revenue
The cleanest distinction is this:
| Metric | What it measures | Typical question |
|---|---|---|
| Sales volume | Quantity sold | How many units moved? |
| Revenue | Money generated from sales | How much income did those sales produce? |
Sales volume counts units. Revenue counts monetary value. A business can sell the same number of units at a higher price and record higher revenue without experiencing higher unit demand. It can also sell more units at a lower realized price and see volume rise while revenue grows slowly or even falls.
Suppose a company sells 1,000 units in a year. That annual sales volume remains 1,000 even if a price change causes revenue to rise or fall sharply. The unit count answers the demand question, while the revenue figure reflects both quantity and realized price. The distinction is also explained in this comparison of sales volume and revenue, which identifies volume with units and revenue with the total money generated.
Use volume when you're evaluating product traction, inventory movement, customer adoption, or channel demand. Use revenue when you're assessing income, pricing results, cash planning, or financial performance. Use both when reviewing business health, because a strong result in one can hide weakness in the other.
A pricing review that looks only at revenue may conclude that demand improved when customers paid more. A product review that looks only at volume may celebrate unit growth without noticing that heavy discounting reduced the money earned per sale. The right decision depends on keeping quantity and value visible as separate measures.
How to Calculate Sales Volume With Formulas
The simplest calculation is a count:
Sales volume = total units sold during the selected period
If a retailer's transaction system records each completed product sale, the team adds those units for the reporting window. A six-month report containing 4,000 completed unit sales therefore has sales volume of 4,000. The underlying method is described in this sales volume calculator guide.
A second method derives units from revenue and unit price:
Sales volume = sales revenue ÷ price per unit
For example, if sales revenue is $45,000 and the price per unit is $30, the implied sales volume is 1,500 units. This approach works only when the price is appropriate for the entire revenue figure. Mixed prices, discounts, bundles, taxes, and refunds can make a simple division misleading.
You can also measure a product's share of total unit volume:
Product volume percentage = individual product units sold × 100 ÷ total units sold
If one product represents 1,500 units out of a total of 5,000 units, its share is 30%. This percentage describes the product's portion of unit movement, not its portion of revenue. Zendesk's documented formula uses the individual product count multiplied by 100 and divided by total units sold (Zendesk's sales volume calculation guidance).
| Method | Formula | Best use case |
|---|---|---|
| Direct unit count | Total units sold in period | Transaction-level reporting |
| Revenue-derived count | Revenue ÷ price per unit | Estimating units when price is consistent |
| Product share | Product units × 100 ÷ total units | Comparing mix across products |
Before calculating, confirm that every input uses the same period and counting rule. Don't add shipments to completed transactions, or count a returned item as a completed sale if your report is meant to show net volume.
Common Variants and Real World Examples
Sales volume becomes more useful when you slice it according to the question being asked. A weekly view can reveal short-term movement, while an annual view can show broader demand. Product-level volume identifies which SKU or service package customers select most often. Regional volume highlights differences between markets, and channel volume separates online, in-store, wholesale, or other routes to purchase.
Consider the period example: a firm selling 4,000 units in six months has a six-month volume of 4,000. That number shouldn't be compared with a monthly figure unless the periods are aligned or the report clearly labels the difference. A company can also report 1,000 units in a year while revenue moves differently because price changes affect value without changing the unit count. These examples reinforce why time and price must remain visible in the report.
Gross volume versus net volume
Gross volume may count every shipment or recorded sale. Net volume may remove returns, cancellations, refunds, or other adjustments. Neither definition is automatically correct. The right choice depends on whether the business wants to measure fulfillment activity, completed customer purchases, or retained sales.
That choice matters especially for subscriptions and B2B services. A “unit” might mean a seat, contract, active account, service package, or completed engagement rather than a physical item. Teams should document the meaning before comparing products or regions. A retailer planning recurring offers may also need to set up volume pricing in Shopify while keeping discounted orders and cancellations consistent in its volume reporting.
For market comparisons, segmentation rules should match the reporting question. A team studying customer groups can pair volume views with B2B market segmentation guidance, then define whether each segment uses gross or net units.
Key Takeaways for Tracking Sales Volume Effectively
A reliable sales volume report starts with a narrow definition, not a complicated dashboard. Write down what counts as one unit, identify the reporting period, and decide whether returns and cancellations are included. Those choices determine whether the result represents shipments, completed transactions, active subscriptions, or another operational concept.
Use this checklist before publishing a number:
- Name the unit: Use a consistent measure for products, contracts, seats, or services.
- Label the period: State whether the figure is weekly, monthly, quarterly, annual, or another defined window.
- Choose gross or net: Explain how refunds, returns, and cancellations affect the total.
- Separate value: Report revenue and pricing alongside volume, but don't merge them.
- Keep comparisons consistent: Apply the same rules across products, regions, and channels.
- Review the source: Confirm that transaction records, invoices, or subscription events support the count.
Sales volume has also become part of formal trade measurement, as shown by Eurostat's sts_trtu_m dataset (Eurostat's official volume measure for wholesale and retail trade). That institutional use reflects the metric's central purpose: isolating the quantity of economic activity from price movement.
For a broader measurement framework, the NanoPIM guide for 2026 can help connect volume with other e-commerce performance measures. Teams evaluating data systems can also review B2B sales intelligence tools and determine which sources support consistent, auditable reporting.
The practical habit is simple: record the unit, period, and adjustment policy every time. Then read volume beside revenue, so managers can tell whether growth came from stronger demand, higher prices, a different product mix, or reporting changes.
Fetchin offers a real-time B2B data API that turns professional profile and company URLs into structured JSON for enrichment and sales intelligence workflows. If your product needs current public professional data to support sales analysis, visit Fetchin and review the available API capabilities.