A common answer to how to calculate addressable market starts with an analyst report, applies a percentage filter, and presents the result as evidence of a large opportunity. That approach is fast, but it often produces a market size your sales team can't identify, reach, or serve.
For B2B SaaS, a stronger model starts with the accounts that fit your ideal customer profile, the revenue each account can generate, and the constraints that determine whether you can reach them. Top-down research still has value as context, but a dynamic bottom-up model gives you a defensible view of demand, capacity, and go-to-market reality.
Table of Contents
- Why Top-Down Market Sizing Fails Modern SaaS
- The Core Framework for Market Layers
- Building a Defensible Bottom-Up Model
- A Practical Calculation for B2B Data Products
- Reconciling Top-Down and Bottom-Up Estimates
- Keeping Your Market Model Dynamic and Fresh
Why Top-Down Market Sizing Fails Modern SaaS
Top-down sizing usually begins with a broad industry revenue figure. A founder finds the size of a software category, applies a product-fit assumption, and claims a small share of the remaining total. The result may look impressive in a pitch deck, yet it rarely tells the team which companies can buy, what they can afford, or whether the current sales motion can reach them.
The problem isn't that industry research is useless. The problem is that broad category revenue often includes products, geographies, customer types, and buying use cases that don't match your offer. A market report might group large enterprises with small businesses, include regions your team can't serve, or count spending on adjacent products that don't compete with your solution.
The gap between industry revenue and reachable demand
A theoretical market is an annualized estimate of demand if the entire reachable market adopted the product. It isn't a forecast or a revenue target. The TAM, SAM, and SOM framework makes that distinction clear by separating the total theoretical opportunity from the portion a company can serve and realistically win.
Implementation friction creates another gap. A buyer may fit your industry and geography filters but lack the technical resources, budget ownership, regulatory approval, or internal urgency required to purchase. A percentage filter can't reveal those conditions. Account-level research can at least make them visible as assumptions to test.
Practical rule: If your market estimate can't produce a named, filterable account universe, it isn't ready to guide pipeline planning.
Static reports also age quickly when pricing, product categories, or buying behavior change. A new workflow platform may replace several point tools, while a narrow feature may become less valuable as buyers consolidate vendors. The market model needs to reflect those changes instead of treating the original category boundary as permanent.
Why bottom-up models withstand scrutiny
A bottom-up model begins with observable units. For B2B SaaS, those units are usually ICP-fit accounts, segmented by factors such as geography, industry, company size, use case, and route to market. You then connect each segment to an annual contract value or another credible measure of annual customer revenue.
This method forces useful questions:
- Who buys: Is the buying entity a company, a business unit, or an individual user?
- What they buy: Is your ACV tied to seats, usage, transactions, or a workflow?
- Where you can sell: Can your product, team, and channel reach the account?
- Why they buy: Does the account have a use case that creates willingness to pay?
Live data extraction makes this approach more practical because teams can refresh company classifications, headcount ranges, locations, domains, and professional roles rather than relying entirely on old spreadsheets. The model becomes a living dataset with traceable inputs, not a fixed ceiling copied from a category headline.
The Core Framework for Market Layers
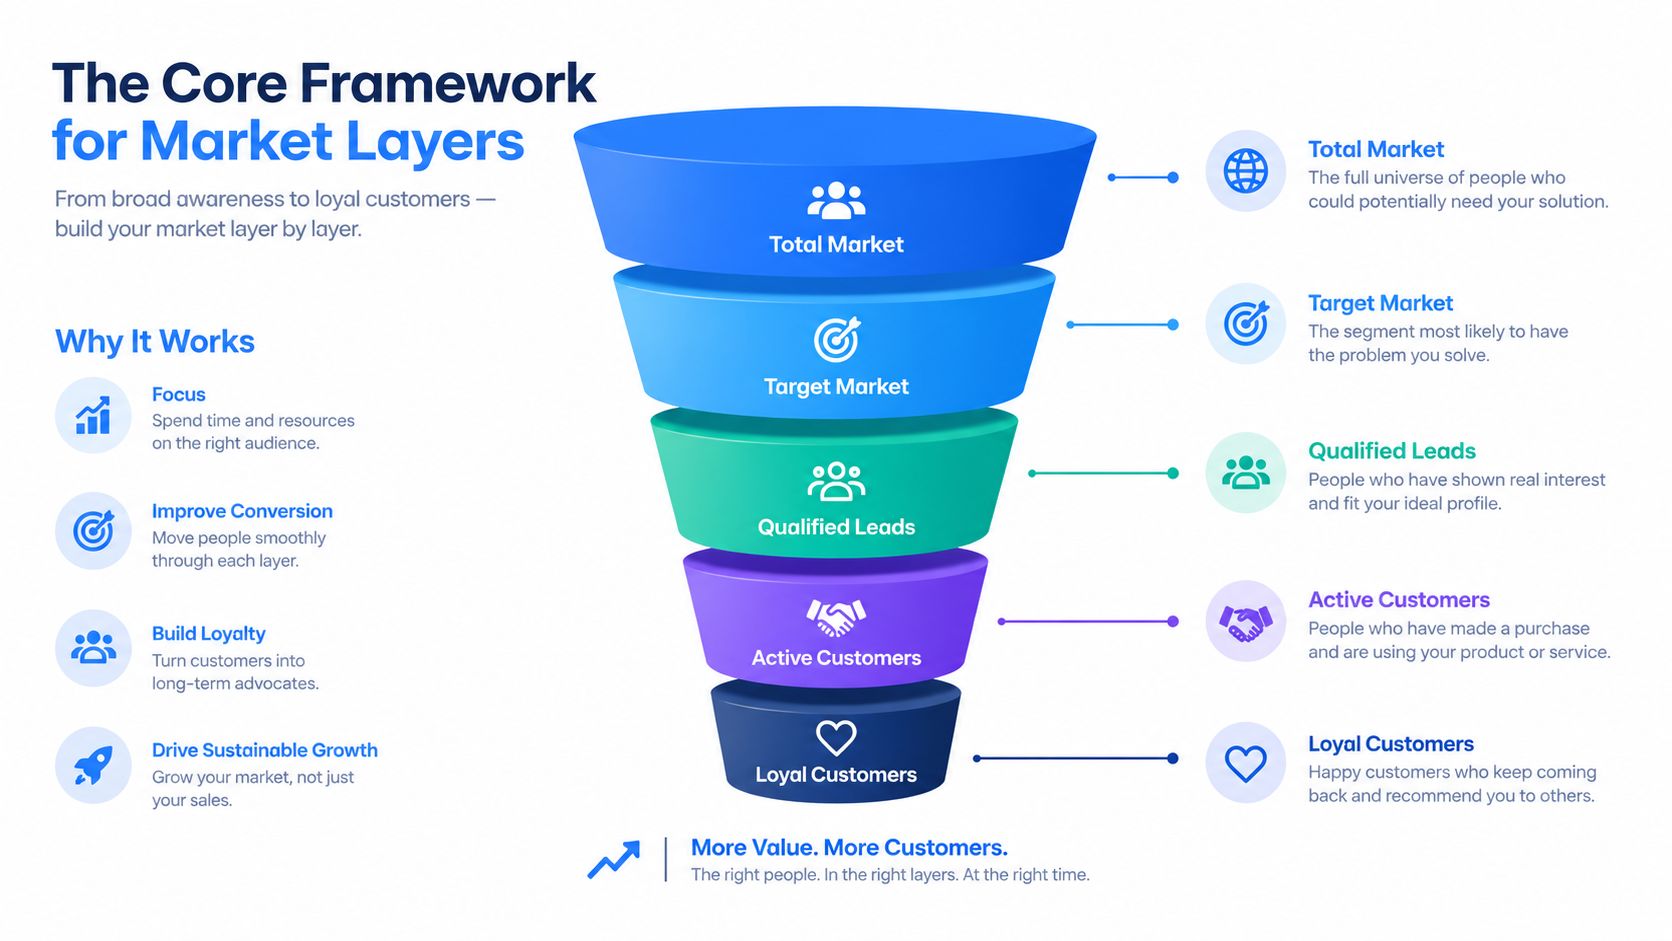
Market sizing becomes useful only when each layer answers a different planning question. TAM, SAM, and SOM should remain separate, because combining them into one headline figure can inflate expectations and hide the constraints that shape revenue.
Total Addressable Market, or TAM, is the theoretical revenue opportunity if every potential customer within the defined market purchased from you. Use a clear customer definition and an economic assumption that matches the business:
TAM = potential customers × average annual revenue per customer
Serviceable Available Market, or SAM, is the portion of TAM your current product, geography, delivery model, and channels can serve. Serviceable Obtainable Market, or SOM, is the near-term portion of SAM that your competitive position, sales capacity, and operating resources can win. This three-layer framework became standard in venture capital and corporate strategy during the 1990s and 2000s, as documented in the history and structure of TAM, SAM, and SOM.
Apply the filters in the right order
Build the model from the broadest valid universe, then narrow it with documented rules:
- Define the market boundary. Specify the problem, product category, customer type, and revenue event being measured.
- Count the theoretical customers. Choose an account or buyer definition and apply it consistently. Do not mix individual professionals with companies.
- Filter for serviceability. Exclude accounts outside your geography, product fit, channel coverage, regulatory reach, or operational capability.
- Estimate obtainable demand. Account for competition, sales capacity, implementation effort, and the share your team can credibly pursue.
- Assign the right economic value. Use ACV, annual usage, or another revenue measure that reflects how customers buy.
The layers are nested. Under consistent definitions, SAM cannot exceed TAM, and SOM cannot exceed SAM. Errors usually arise when the filters change between layers. For example, a company might count global accounts in TAM, limit SAM to one region, then calculate SOM from a different customer segment without recording the change.
Use live professional data APIs to refresh the inputs behind these filters. Company classifications, locations, roles, and other market signals change, so a layer model based on current records is more defensible than one copied from a static industry report.
Segmentation should happen before aggregation. The guidance on B2B market segmentation helps structure differences in account type, use case, and geography, each of which can alter both eligible-buyer counts and the ACV assigned to a segment.
Present TAM as context, SAM as the operational market, and SOM as the planning number. Investors may want the broad opportunity, while sales and product teams need a clear view of which accounts can be served and what the organization can credibly win.
Building a Defensible Bottom-Up Model
The bottom-up calculation is simple. The work lies in making every input credible.
For a B2B product, begin with the number of reachable accounts that fit the ICP. Multiply that count by the average annual revenue per account. The result is a market estimate tied directly to pricing and customer coverage, rather than a broad percentage of an unrelated industry total. Several B2B market-size guides recommend customer counts multiplied by annual spend per customer for precisely this reason.
Start with accounts, not people
An account may contain many potential users, champions, and decision-makers, but it remains one buying entity. Counting every professional role as a separate customer can inflate the market when several roles belong to the same company. Build the primary universe at the account level, then use professional data to understand buying committees and likely access points.
A clean account table should preserve:
| Field | Why it matters |
|---|---|
| Company identity | Prevents duplicate records and double-counting |
| Industry and use case | Separates genuine product fit from adjacent demand |
| Geography | Applies service and sales coverage constraints |
| Company size | Supports segment-specific pricing and capacity assumptions |
| Buying role | Helps plan access without treating each person as a separate account |
| Annual contract value | Converts reachable accounts into revenue potential |
Segment before multiplying. A small company, a mid-market buyer, and an enterprise account may all fit the same industry filter, but they rarely have the same implementation requirements or willingness to pay. If you assign one blended ACV to all of them, the result can hide the segment that supports the business.
Use this structure instead:
Segment TAM = accounts in segment × annual revenue per account
Then add the segment totals. This keeps the calculation auditable and shows which parts of the market create the economic opportunity.
Document every exclusion
A defensible model records why an account was included or removed. Exclude companies that fall outside the product's supported geography, lack the required technical environment, belong to a non-target industry, or cannot be reached through the available sales channel. Don't use a vague “addressable percentage” when a firmographic or operational filter can describe the boundary more precisely.
The B2B company-list methodology provides a useful way to think about the account universe. The objective isn't to create the largest possible list. It's to create a reproducible list that another person can inspect, refresh, and challenge.
A model also needs a willingness-to-pay check. A company may fit the ICP but still produce little economic value if the problem is infrequent, the buyer has no budget, or implementation costs outweigh the expected benefit. Pricing research, customer interviews, existing contracts, and win-loss evidence should inform ACV assumptions where available.
A good bottom-up model doesn't pretend to know the future with precision. It makes uncertainty visible. Keep the account count, segment rules, ACV, and exclusions in separate fields so you can change one assumption without rebuilding the entire analysis.
A Practical Calculation for B2B Data Products
Consider a hypothetical B2B data API that fetches professional profile and company information for SaaS products. Its buyers might include sales intelligence platforms, recruiting systems, automation products, and internal data teams. The first mistake would be to count every professional who could appear in the output. The buying entity is usually the company integrating the API.
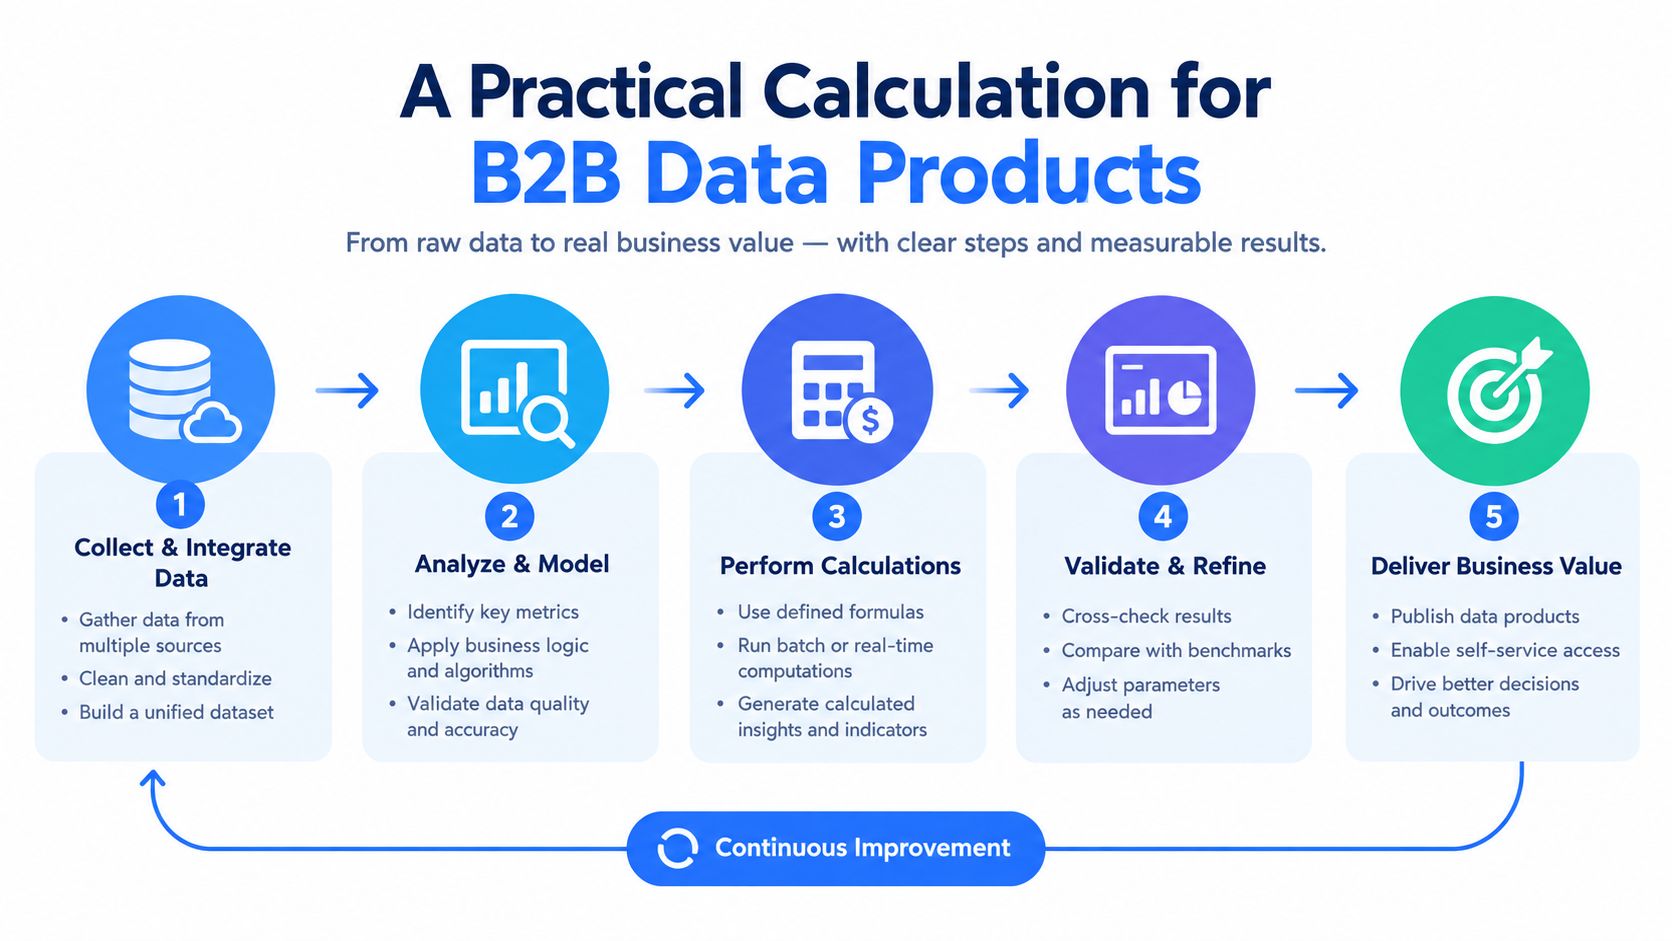
Start by defining the account boundary. For this example, the target is U.S.-based SMB and mid-market technology companies whose products need structured professional or company data. The model should identify company records, verify industry classification, check headcount, confirm location, and remove duplicates. A professional data API can support this process by extracting current firmographics from company URLs and current role information from professional profile URLs.
Build the account universe
Use a source-linked workflow:
- Define the ICP: Specify geography, industry, company-size range, product use case, and integration requirements.
- Resolve company identity: Normalize company names, domains, and company URLs so the same account isn't counted more than once.
- Validate firmographics: Check industry, headcount, headquarters, and domain against current records.
- Classify the buying use case: Separate sales enrichment, recruiting, research, workflow automation, and other applications.
- Assign commercial assumptions: Apply the ACV appropriate to each segment, then record the source and date for the assumption.
Suppose the verified account universe contains 80,000 U.S.-based SMB and mid-market companies, and the assumed ACV is $5,000. The resulting SAM is:
80,000 accounts × $5,000 ACV = $400 million SAM
This illustration appears in a published market-sizing example from ZoomInfo. It demonstrates the important principle, but it shouldn't be presented as evidence that every B2B data API has the same market. The number of accounts must come from your own definition and validation process, while the ACV must reflect your pricing, usage limits, implementation effort, and buyer budget.
Test the calculation against operating reality
The arithmetic is only the midpoint of the analysis. Ask whether the product can serve every account in the filtered universe. Some companies may require security reviews, custom contracts, regional support, or data fields the API doesn't provide. Others may have a use case but no immediate project.
Separate the SAM from the SOM by applying realistic constraints. Consider the number of accounts your sales team can work, the channels that can reach them, competitive incumbency, and the time required to convert and onboard each customer. Don't turn those constraints into an unsupported percentage. Describe them as explicit assumptions and model alternative outcomes qualitatively or with ranges supported by your own data.
The final output should include more than one total:
- Account count: The number of unique ICP-fit companies.
- Revenue potential: The account count multiplied by segment-specific ACV.
- Coverage boundary: Geography, product, channel, and regulatory limits.
- Data confidence: Which fields are verified, inferred, or outdated.
- SOM rationale: The sales and delivery capacity supporting the near-term opportunity.
That format lets a board or investor challenge the assumptions without dismissing the entire model. If headcount changes the ACV, change the segment. If a new feature expands product fit, add the newly eligible accounts as a separate scenario instead of rewriting the original SAM.
Reconciling Top-Down and Bottom-Up Estimates
Top-down and bottom-up models answer different questions. Top-down analysis shows whether your opportunity fits within a broader category. Bottom-up analysis shows whether enough reachable accounts exist at a price your business can support.
Use both, but don't average them automatically. Start with the broad industry figure, define exactly what it includes, and then build an independent account-level estimate using your ICP, pricing, geography, and sales constraints. The top-down and bottom-up market-sizing comparison describes this distinction clearly: one method narrows a broad figure with filters, while the other builds upward from concrete customers or transactions.
Investigate divergence instead of hiding it
If the two estimates differ materially, treat that as a research finding. The gap may come from:
- Different market boundaries: The industry report may include adjacent categories or customer groups.
- Different time periods: One estimate may use older pricing or account data.
- Duplicate segments: The same company may appear in multiple use-case or industry groups.
- Different revenue definitions: Category revenue may include services, hardware, or indirect channels.
- Unrealistic ACV: Your pricing assumption may not match actual willingness to pay.
- Coverage constraints: Your product or channel may reach only a narrow portion of the reported market.
One expert guide recommends investigating a divergence greater than 3x, warning that the highest estimate is likely wrong when analyst, government, and bottom-up views vary that widely. See the hybrid market-sizing workflow and divergence test for the underlying guidance.
Don't force agreement by changing the bottom-up count until it resembles the report. Recheck the account definition, remove duplicates, reconcile geography, and separate current spend from potential future workflow adoption. If the broad figure remains larger, keep it as context and explain why the serviceable model is narrower.
Turn SOM into a capacity model
SOM should reflect more than competitive ambition. It needs a connection to the number of accounts your organization can identify, contact, qualify, onboard, and support. A product with a large SAM but limited implementation capacity may have a smaller obtainable market than its sales plan suggests.
Build best, base, and worst cases by varying the assumptions that affect outcomes. For example, you might change the eligible account count, segment ACV, sales coverage, or implementation constraint. The model should show which variable causes the greatest sensitivity, not present false precision.
A useful decision table looks like this:
| Question | Top-down signal | Bottom-up test |
|---|---|---|
| Is the category large enough? | Broad industry revenue | Total ICP-fit account value |
| Can we serve it? | Segment filters | Product, geography, and channel eligibility |
| Can we win it? | General market-share context | Sales capacity and competitive account access |
| Should we invest? | Category direction | Segment economics and operating constraints |
The strongest plan doesn't choose the largest number. It explains why the selected SAM and SOM are credible, what evidence supports them, and which assumptions the team will validate next.
Keeping Your Market Model Dynamic and Fresh
An addressable market changes when your product, pricing, customer base, regulations, and sales channels change. Treating the calculation as a one-time fundraising exercise guarantees that the model will drift away from operating reality.
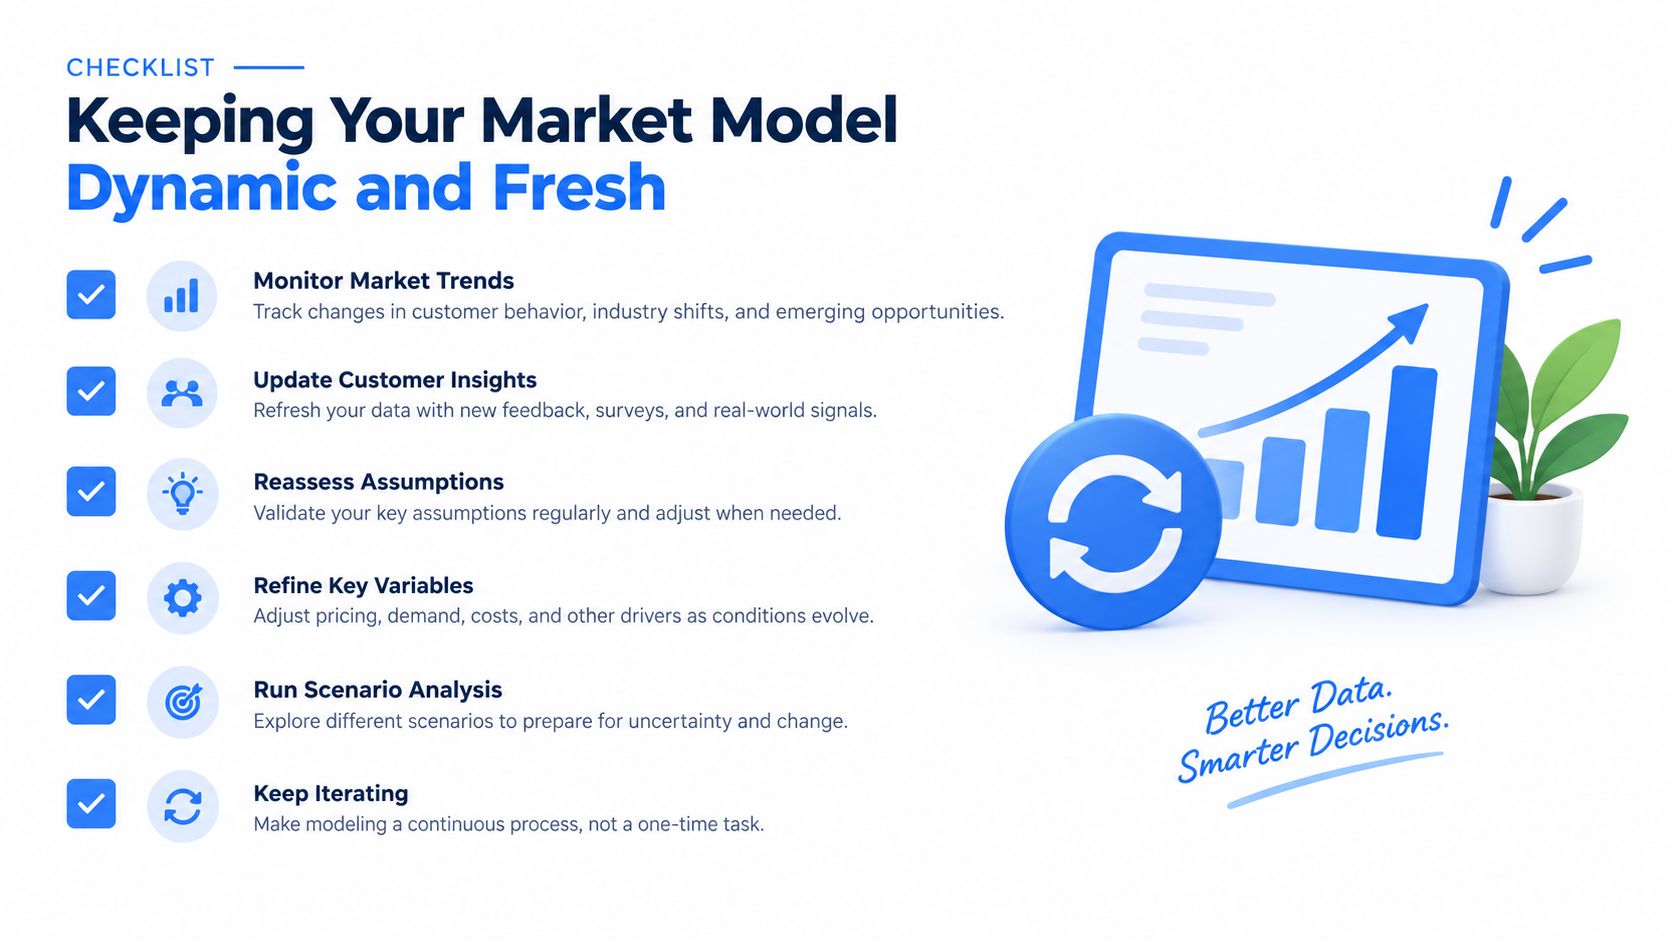
A dynamic model links every major input to a source, a definition, and a refresh date. Account records should be refreshed as company details change. Pricing assumptions should reflect current packaging and usage. Product expansion should create a new segment or scenario, not enlarge the original market.
Maintain a source-linked operating file
A practical market model should contain:
- A stable account key: Prevents duplicates when records refresh.
- Current firmographics: Keeps industry, geography, headcount, and domain fields aligned with reality.
- Segment rules: Shows why each account belongs in TAM, SAM, or a narrower use-case group.
- ACV assumptions: Records pricing logic by account type and use case.
- Exclusion reasons: Makes removals inspectable rather than arbitrary.
- Scenario fields: Separates current spend, expanded workflow adoption, and constrained capacity.
- Change history: Shows what changed and why the market total moved.
The company data enrichment workflow is relevant because enrichment isn't only a lead-generation task. It can also maintain the firmographic layer behind a market model, provided the team records provenance and doesn't treat every returned field as equally certain.
Recalculate when the business changes
Review the model after a meaningful product launch, a pricing change, a new geographic market, a channel shift, or a change in regulatory reach. Revisit it when customers begin buying a broader workflow rather than a narrow feature, because that can change both the account boundary and the ACV.
B2B buying behavior also affects the shape of the opportunity. Tool consolidation can compress demand for isolated point solutions while expanding the opportunity for platforms that replace several workflows. That isn't a reason to inflate TAM. It is a reason to model current spend separately from the value your product could capture if the buyer adopts a wider workflow.
The most useful market size is the one your team can explain account by account. Build from real buyers, validate the economics, reconcile the result against broader research, and refresh the inputs whenever the business or market boundary changes.
Fetchin provides a B2B data API that turns professional profile and company URLs into structured JSON for live data extraction and product workflows. Use it to validate account counts, firmographics, and buyer data before you commit to a market assumption, then visit Fetchin to explore the API.